1. The interaction of the tumor suppressor p53 with the ubiquitin ligase COP1 as studied by SPR (direct immobilization method)
Moscetti et al., International Journal of Nanomedicine. (2018). doi:10.2147/IJN.S152214.
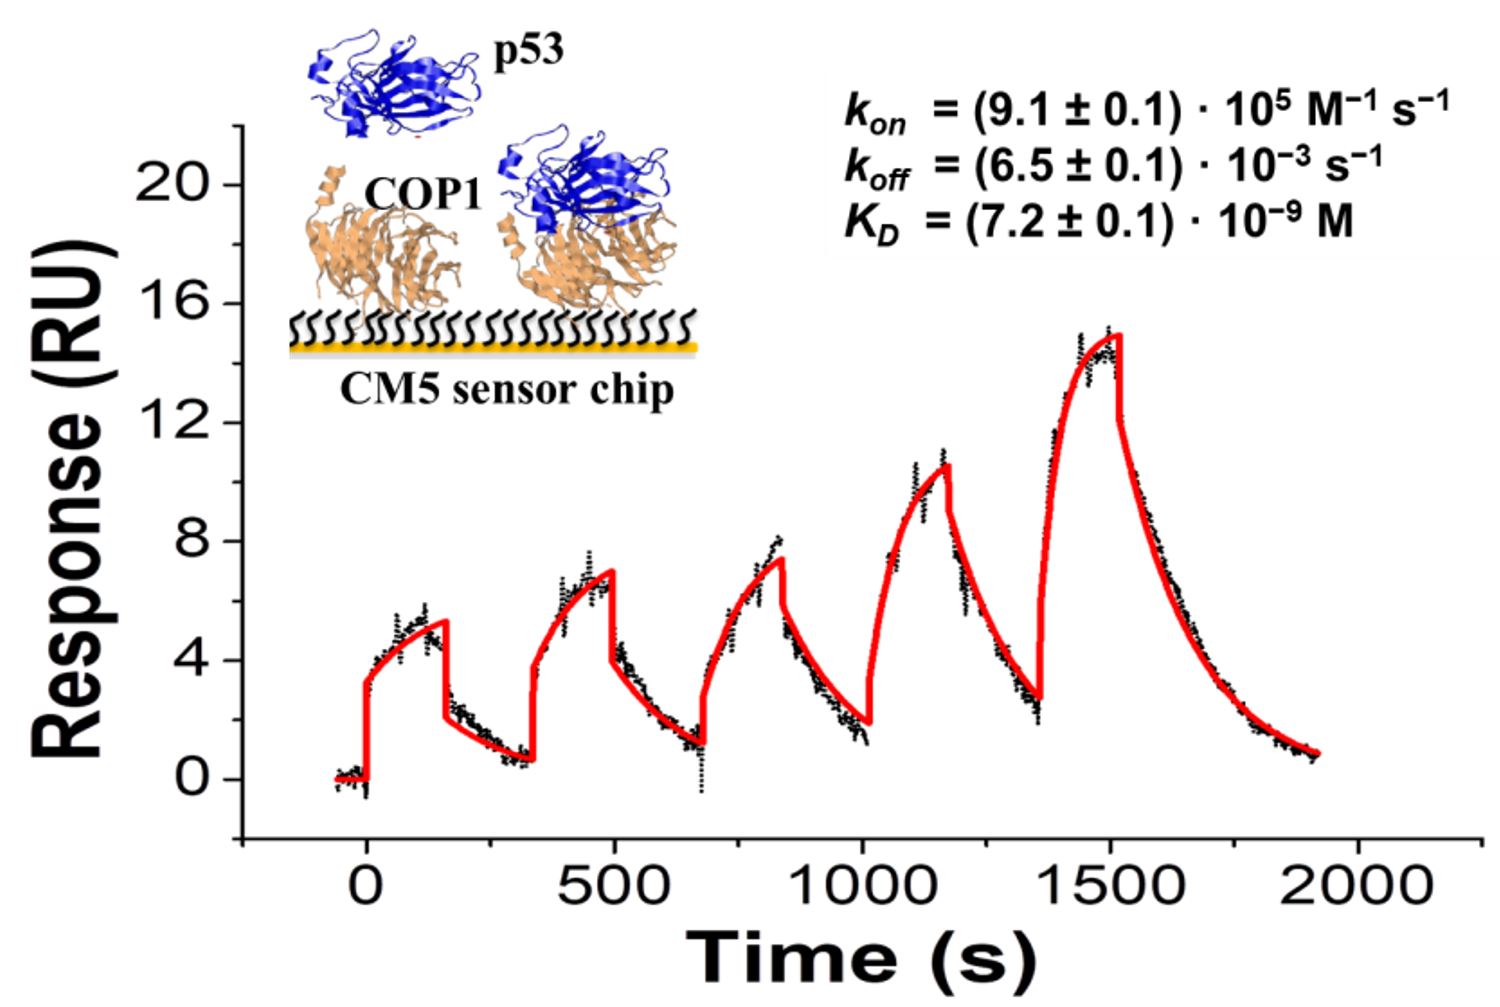
Sensorgram (black dotted curve) of the response (Resonance Units, RU) versus time of single-cycle kinetics (SCK) performed by injecting five increasing concentrations (1.5-20 nM) of COP1 over a p53-functionalized substrate. The red solid curve was obtained by fitting data with the Langmuir 1:1 binding model (BiaEvaluation software). A schematic representation of the binding experiment is shown (upside, left). The association rate constant (kon), the dissociation rate constant (koff,) and the equilibrium dissociation constant (KD) obtained from the fitting procedure are also shown (upside, right).
2. The interaction of the tumor suppressor p53 with the oncogenic mutant p53R175H as studied by SPR (immunocapture method)
Moscetti et al., Biophys. Chem. 228 (2017) 55–61. doi:10.1016/j.bpc.2017.07.002.
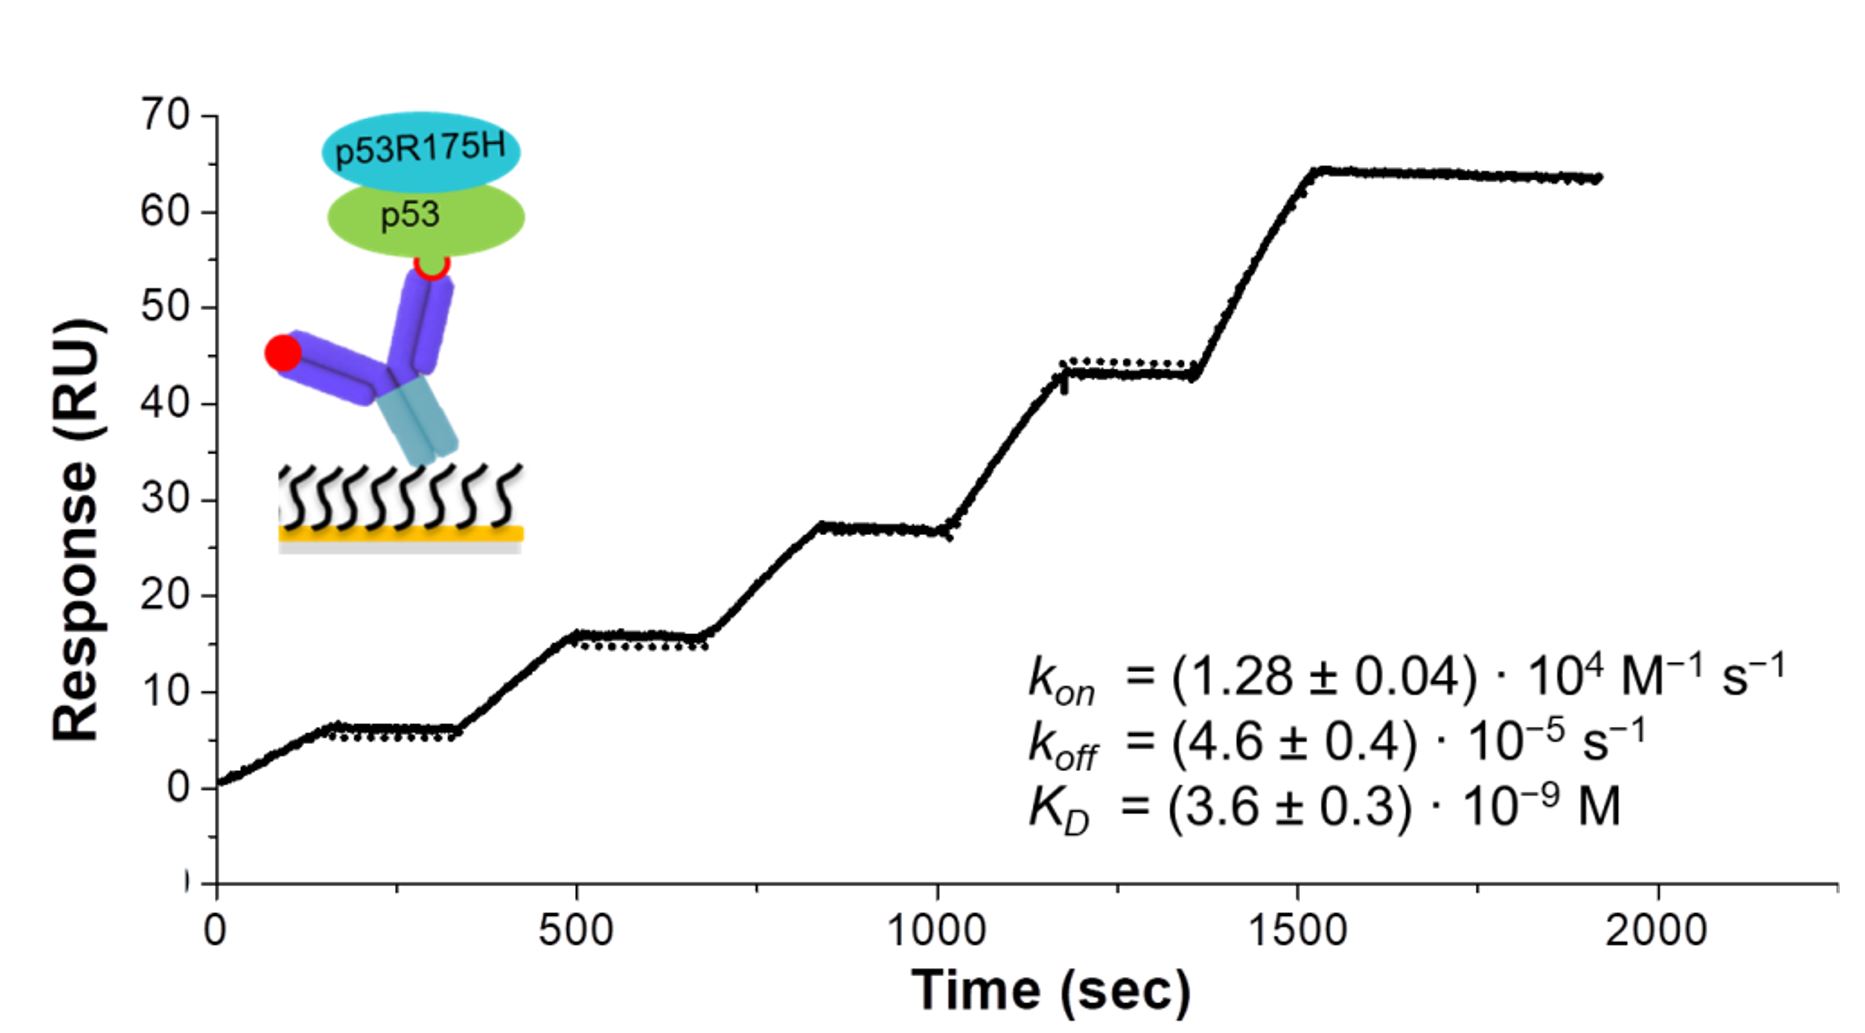
The sensorgram (black dotted curve) shows the response (Resonance Units, RU) versus time of the SCK assay performed by injecting five increasing concentrations (33.3- 400 nM) of p53R175H over the p53wt-functionalized substrate, without any regeneration. The black solid curve was obtained by fitting data with the 1:1 binding model (BiaEvaluation software). The kinetic parameters obtained from the fitting procedure are shown (bottom, right). A schematic representation of the binding experiment is also shown (upside, left).
3. The interaction of the tumor suppressor p53 with the anticancer peptide p28 as studied by SPR (immunocapture method)
Moscetti et al., Sensors (Basel). 17 (2017). doi:10.3390/s17112680.
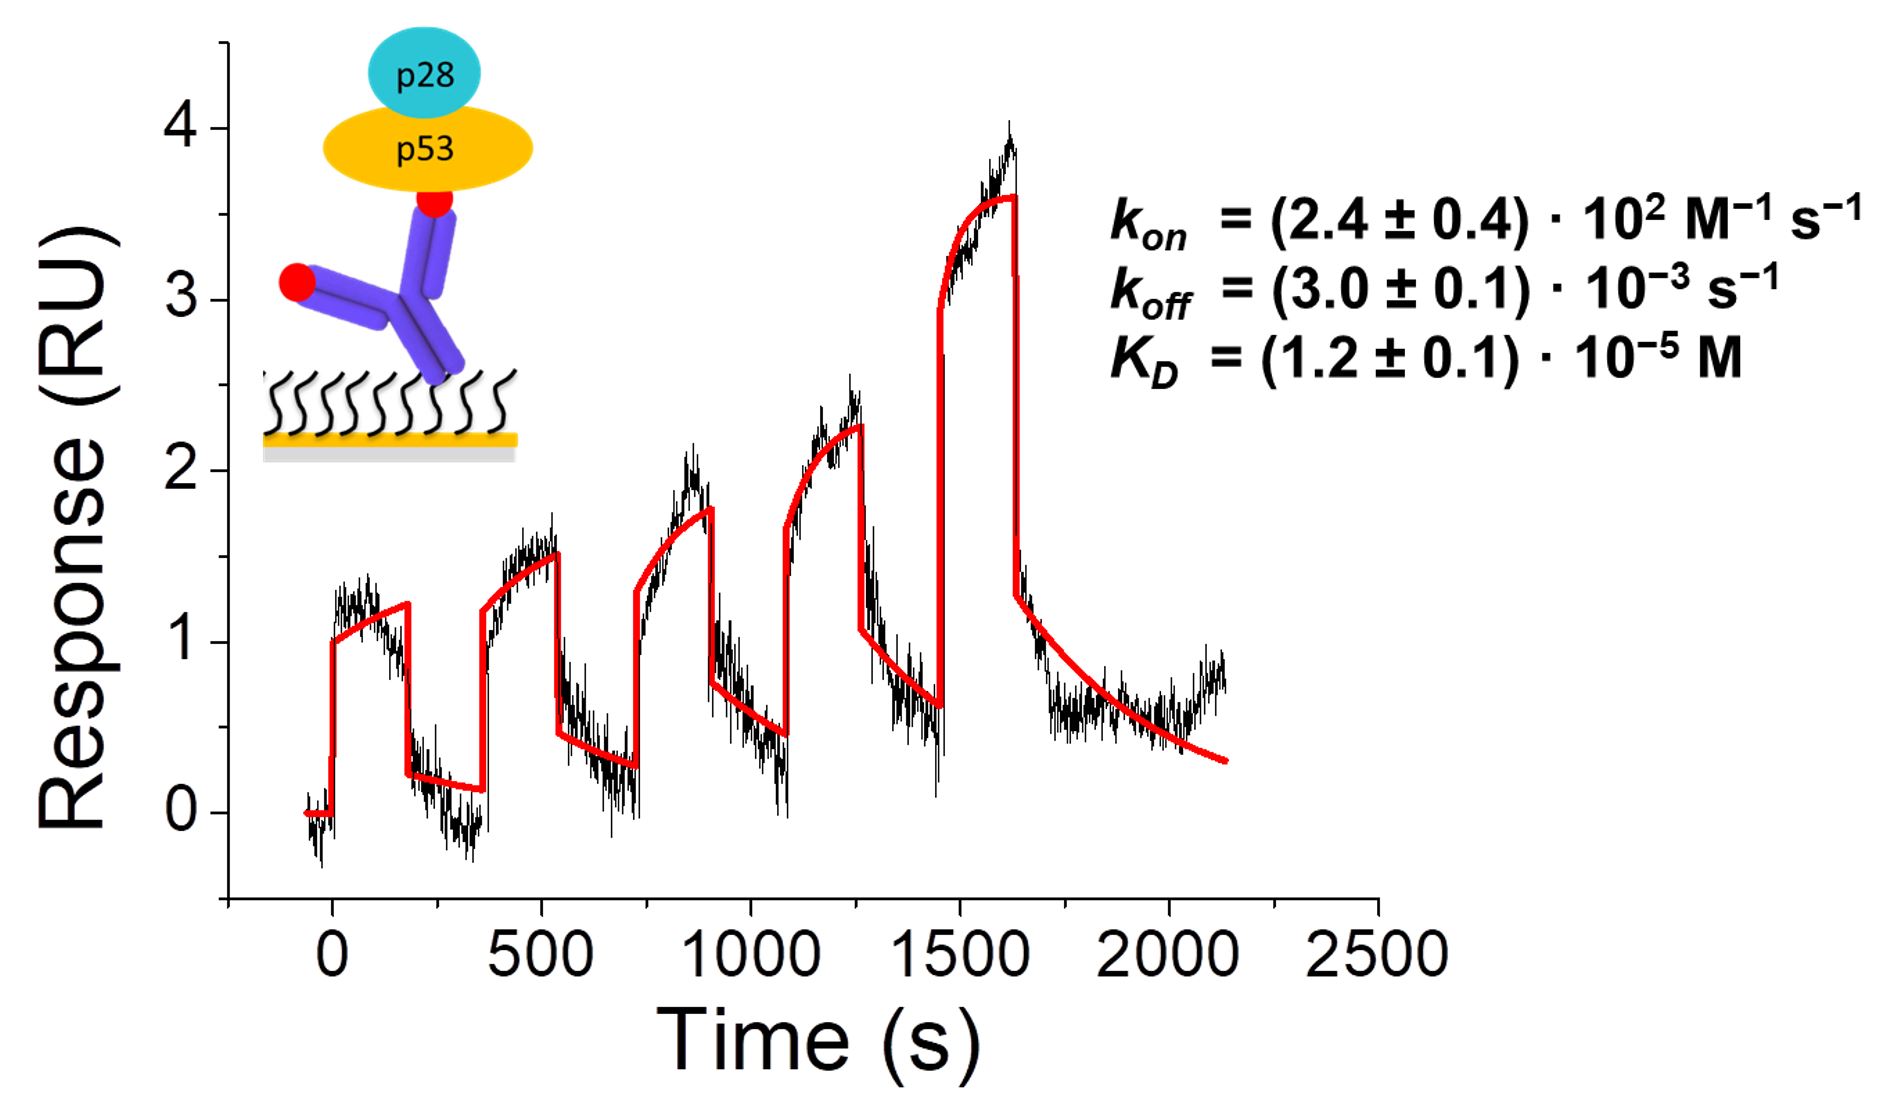
Sensorgram of the Single-Cycle Kinetics performed by injecting five increasing concentrations (5 - 80 nM) of p28 over a p53-functionalized substrate (black curve). The red curve shows the best fit of the sensorgram with the 1:1 binding model (BiaEvaluation software). The kinetic parameters obtained from the fitting procedure are shown. A representation of the interaction scheme is also shown (upside, left).